Between your DMS, your OEM reports, your spreadsheets, and your financials, your dealership almost certainly has more data on hand right now than at any point in its history. The question isn’t whether you have enough information. It’s whether you’re using it to make better decisions.
Lauren Guderyon, Product Specialist for Analytics at DIS, says most dealerships don’t have a data problem. They have an attention problem. Almost every dealer she speaks with can already pull a report on nearly anything. The real challenge is identifying what matters quickly enough to act.
That comes down to three habits: knowing which numbers matter, knowing how to read them, and making sure someone acts on them.
Habit 1: Know What Matters
Start by letting go of one common misconception: the goal isn’t to have more dashboards. It’s to make it clear, quickly, where a manager’s attention is needed most. Between DMS reports, OEM data, and spreadsheets, dealerships can track dozens of metrics: ROI, CSI, GP$, ELR, PVR, F&I, CPO, AR, and WIP. Yet many of these numbers never lead to action.
A number is worth monitoring only if it meets two criteria: it’s tied to a decision, and someone would actually act on it today. Everything else is noise dressed up as a KPI.
Here’s the framework to keep in mind: Data → Information → Insight → Action → Result. Let’s see how it works with a real example: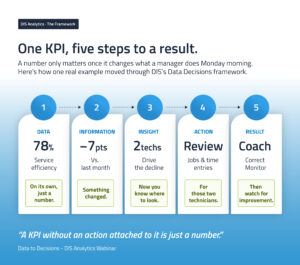
- Data: Service efficiency is 78%. On its own, that’s just a number.
- Information: That’s down 7 points from last month. Now you know something has changed.
- Insight: Two technicians account for most of the decline. Now you know where to focus your attention.
- Action: Review those two technicians’ jobs and time entries.
- Result: Coach, correct, and monitor performance for improvement.
Habit 2: Manage the Exceptions, Not the Average
Once you know which numbers matter, the next habit is just as important: knowing how to interpret them. The same number can look perfectly fine or signal a serious problem, depending on whether you’re looking at the overall average or the exceptions hidden beneath it.
Imagine a dashboard showing service efficiency at 92%. Everything is green, and at first glance, things look fine. But does that number tell you everything you need to know? Not even close. Beneath that average, Tech A is at 112%, Tech B at 105%, Tech C at 91% (watch), and Tech D at 63%, a significant exception hiding in plain sight. 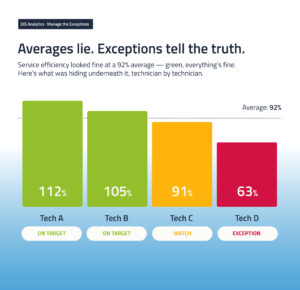
Averages tell you how the business performed. Exceptions show you where management attention is needed.
A quick gut check. Could you answer these questions right now, without looking anything up?
- What’s your current service WIP?
- Which technician has experienced the biggest decline in efficiency?
- How much inventory hasn’t moved in 12+ months?
- Which department missed its margin target last month?
- How long does completed work sit before it’s invoiced?
If answering these questions requires three reports, an Excel export, and a phone call, that’s an opportunity to improve how you access and use your data.
What This Looks Like, Department by Department
Once you know what to monitor and how to identify exceptions, the same sequence (metric → exception → root cause → owner → action) can be applied across the dealership. Here are a few examples, using sample figures for each department.
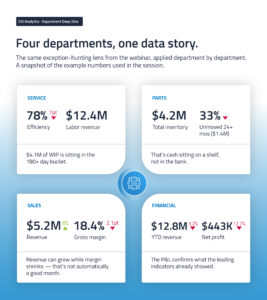
Service. Focus on technician efficiency, WIP aging, dwell time, and time to close. Service efficiency stood at 78%, against $12.4M in labor revenue, an average dwell time of 4.1 days, and a time to close of 2.7 days. Meanwhile, $4.1M in WIP sat in the 180+ day aging bucket. High WIP isn’t the decision itself. It’s the signal that tells you where to start asking questions.
Parts. Focus on aging, no-movement inventory, turns, and negative inventory. Of the $4.2M in total inventory, $1.4M (33%) didn’t move in 24+ months. That’s money sitting on a shelf instead of in your bank account.
Sales. Higher sales don’t always translate into better sales. Revenue increased 8% to $5.2M, but gross margin slipped 2.1 points to 18.4%. Revenue can grow while margins shrink. The goal is profitable growth, not growth alone.
Financial. Your P&L tells you what has already happened, making it a lagging indicator. Technician efficiency, WIP, inventory aging, and margin trends are leading indicators. They show you what’s happening now, while there’s still time to intervene.
Year-to-date revenue was down 3.2% to $12.8M, gross profit was down 6.1% to $2.15M, and net profit was down 12.7% to $443K. The chain behind those results matters: efficiency drops, labor revenue declines, margins come under pressure, and net profit falls. By monitoring leading indicators, you can identify this chain as it develops instead of discovering the impact on your financial results two months later.
Spotting the exception is half the job. The other half is making sure someone owns it.
Habit 3: Create Accountability (and Make It Stick)
Every manager in your dealership should be able to answer five questions about their department on any given day:
- What changed?
- What’s off target?
- Why?
- What are we doing about it?
- Who owns the next action?
Accountability isn’t just about sharing numbers with someone. It’s about agreeing on what good performance looks like, recognizing when results fall short, and deciding who’s responsible for the next action, whether or not you invest in software to support the process.
Build a Management Rhythm
Not every KPI needs your attention every day. Instead, establish a consistent management rhythm that gives the right metrics attention at the right time.
- Daily (every morning): exceptions, WIP issues, customer issues, and bottlenecks.
- Weekly (Monday review): efficiency, dwell time, inventory movement, margin trends, and sales activity.
- Monthly (close-out review): P&L, department profitability, inventory turns, goals vs. actual, and location comparison.
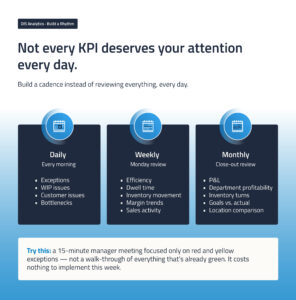
Try introducing a 15-minute manager meeting focused exclusively on red and yellow exceptions, rather than reviewing everything that’s already green. It’s a simple change you can implement this week at no cost.
Where AI Fits (Without the Hype)
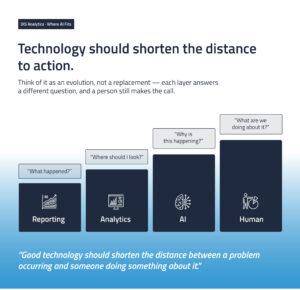
Technology should shorten the time between a problem occurring and someone taking action. That’s the real measure of its value.
Think of it as an evolution. Reporting answers, “What happened?” Analytics answers, “Where should I look?” AI answers, “Why is this happening, and what should I investigate?” But the final question, “What are we going to do about it?”, still requires a person.
With tools like DIS Dealer Analytics and Dex, its built-in AI assistant, this can mean asking questions such as “Why did service profitability decline?”, “Which location is underperforming?”, “Which technicians are trending below goal?”, or “What changed this month?” and getting a clear answer instead of having to reconcile multiple reports yourself.
AI can be genuinely useful for eliminating repetitive manual work and identifying service, parts, and margin trends that might otherwise go unnoticed during a manual review. It isn’t the right fit for every task. Complex negotiations, technician diagnostics, and high-stakes decisions still require human judgment.
Tools with native access to work orders, inventory, and customer records also tend to outperform generic, bolted-on add-ons. As with any other investment, evaluate AI tools on their return on investment (ROI), not the hype surrounding them. For a deeper look, read What AI Can (and Can’t) Do for Your Dealership Today.
What Will You Do Monday?
Here are five things you can start doing immediately:
- Choose 5–10 KPIs that genuinely drive your business, rather than trying to track fifty.
- Define what good performance looks like for each one. Without a target, a KPI tells you very little.
- Manage exceptions, not averages.
- Establish a daily, weekly, and monthly management rhythm.
- Attach an action and an owner to every meaningful exception.
You don’t need to change thirty things by Monday morning. Start with one number you need better visibility into, one process you need to improve, or one question you want to ask your managers differently. Pick one and build from there.
Want help turning your dealership’s data into decisions? Let’s Talk
About DIS
Dealer Information Systems (DIS) Corp provides dealer management system (DMS) software for agriculture, lift truck, construction, and truck refrigeration dealers in North America. Its products, including Quantum and QuipWare, support more than 2,400 dealer locations. Founded in 1980 and headquartered in Bellingham, Washington, DIS is a Constellation Software company. Learn more at discorp.com.