


Your service department is probably busier than it’s ever been. Technicians are booked out. The backlog is growing. Customers are calling for updates. And somewhere in the middle of all that activity, it feels like things are running okay.
But “feeling okay” and knowing you’re performing well are two very different things.
When equipment sales are down, your service department becomes the backbone of your business. It’s the most stable source of recurring revenue you have. But that only works if you’re actually measuring the right things and know where you stand.
So, let’s talk about the KPIs that matter most for an equipment dealership service department, what good looks like, and how to start using them to make better decisions.
Why Most Dealers Track Too Many (or Too Few) Metrics
Here’s what we see across the 2,00+ dealership locations we work with: dealers tend to fall into one of two camps.
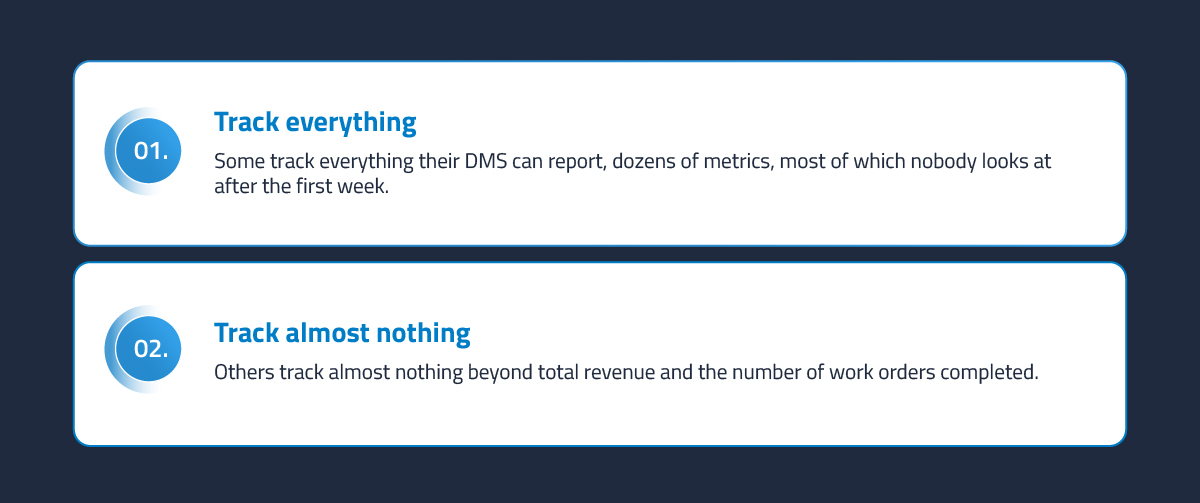
Neither approach actually helps you run a better service department. The goal isn’t more data. It’s the right data, reviewed consistently, and acted on.
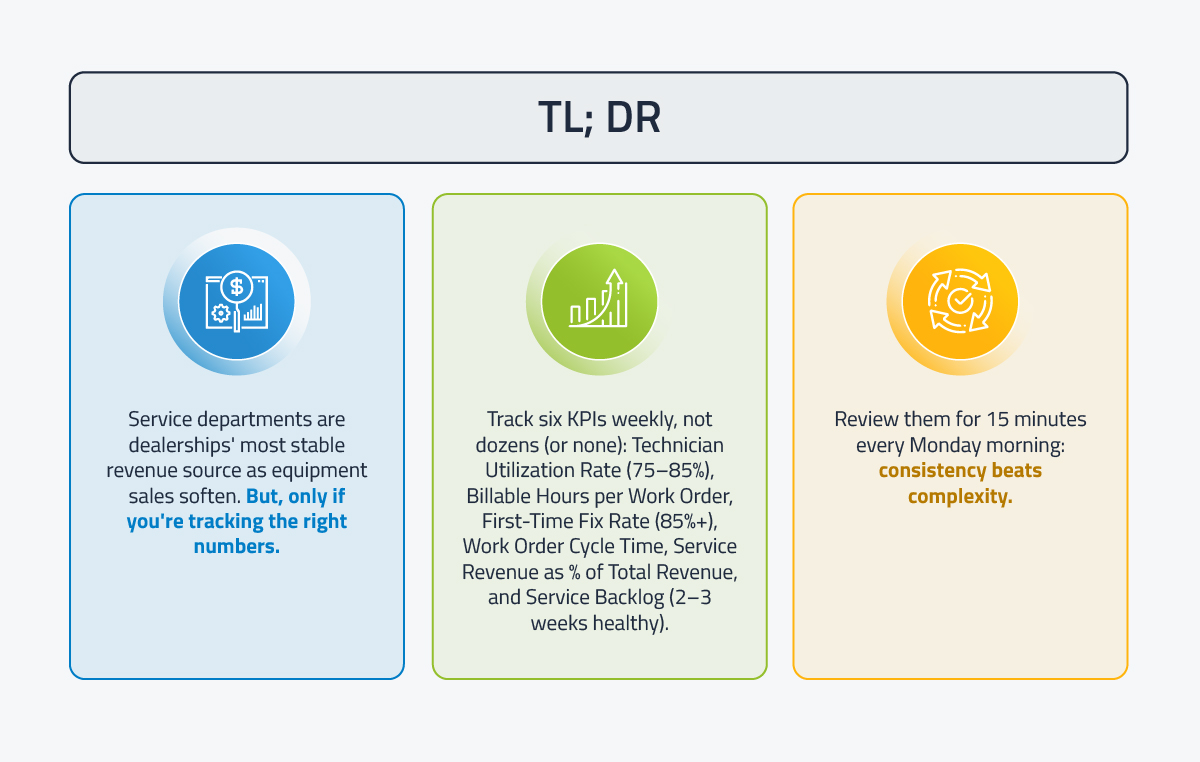
Here are the six KPIs we’d recommend every equipment dealer service manager focus on.
The 6 KPIs That Move the Needle
1. Technician Utilization Rate
This is the most fundamental service metric: of the hours your technicians are available to work, how many are actually spent on billable tasks? It sounds simple, but it’s where most profit leaks start.
What it measures: Billable hours divided by total available hours.
Where you want to be: Most well-run equipment dealerships target 75–85%. If you’re below 70%, you’re leaving significant revenue on the table. If you’re consistently above 90%, your team is likely headed for burnout, especially in a market where finding replacement technicians is nearly impossible.
The insight: Low utilization usually isn’t a “lazy tech” problem. It’s a workflow problem. Techs waiting for parts. Techs walk to the office to pick up paperwork. Techs are searching for service history that should be readily available.
These are system problems, not people problems.
2. Billable Hours per Work Order
This metric tells you how efficient your team is at completing jobs and whether you’re capturing all the time that should be billed.
What to watch for: If your average billable hours per work order is declining over time but your work is getting more complex, that’s a red flag. It may mean technicians are underreporting time, work orders aren’t being documented properly, or your service writers aren’t capturing the full scope of the job at intake.
3. First-Time Fix Rate
How often does a piece of equipment come back because the repair wasn’t done right the first time? Every comeback costs you twice—once in the rework itself, and again in the customer’s trust.
Where you want to be: Above 85%. Top-performing service departments push toward 90%+. If you see a high comeback rate tied to specific technicians or repair types, that’s a training opportunity, not necessarily a performance issue.
4. Work Order Cycle Time
From the moment a work order is opened to the moment the equipment rolls out the door—how long does that take? This is the metric your customers feel most directly, even if they never see the number.
The insight: Long cycle times almost always trace back to one of three bottlenecks: parts availability (the part wasn’t in stock), scheduling gaps (the job sat waiting for a tech), or communication delays (nobody told the customer the quote was ready for approval). Your DMS should help you identify which bottleneck is dragging you down.

5. Service Revenue as a Percentage of Total Revenue
This is a strategic metric, not just an operational one. It tells you how dependent your dealership is on equipment sales versus how much of your revenue comes from the more stable, recurring service side of the business.
Why it matters now: With nearly 68% of dealers reporting sales declines in 2025 and continued softness expected in 2026, the dealerships with a higher share of service revenue are simply more resilient. This is the core of fixed absorption, the idea that your service and parts revenue should cover your fixed costs, leaving equipment sales as pure upside.
6. Service Backlog (in Days)
How far is your service department booked? A healthy backlog means strong demand. An excessive backlog means you’re losing customers to competitors who can get the work done sooner.
The balance: A backlog of two to three weeks is typically healthy. If you’re booked out six weeks or more, you’re not just busy, you’re at risk. Customers who can’t get service from you will find someone else. And in today’s market, you might not get them back.
The Real Question: Are You Reviewing These Consistently?
Knowing which KPIs to track is only half the equation. The other half is building the habit of reviewing them: weekly, not quarterly. The best service managers we work with spend 15 minutes every Monday morning looking at these six numbers. That’s it. Fifteen minutes. But those fifteen minutes shape every decision they make for the rest of the week.
Your DMS should make this easy. If pulling these numbers requires exporting spreadsheets, merging data from multiple systems, or asking someone to build a custom report, you’re spending more time gathering data than acting on it. And that’s a problem worth solving.
Where Do You Stand?
If you’re not sure how your service department stacks up, that’s a good starting point. Knowing what you don’t know is the first step toward running a tighter operation. Pick one or two of these KPIs, start tracking them consistently, and use the trends to guide your next move.
Want to see how DIS makes KPI tracking simple? Let’s talk.